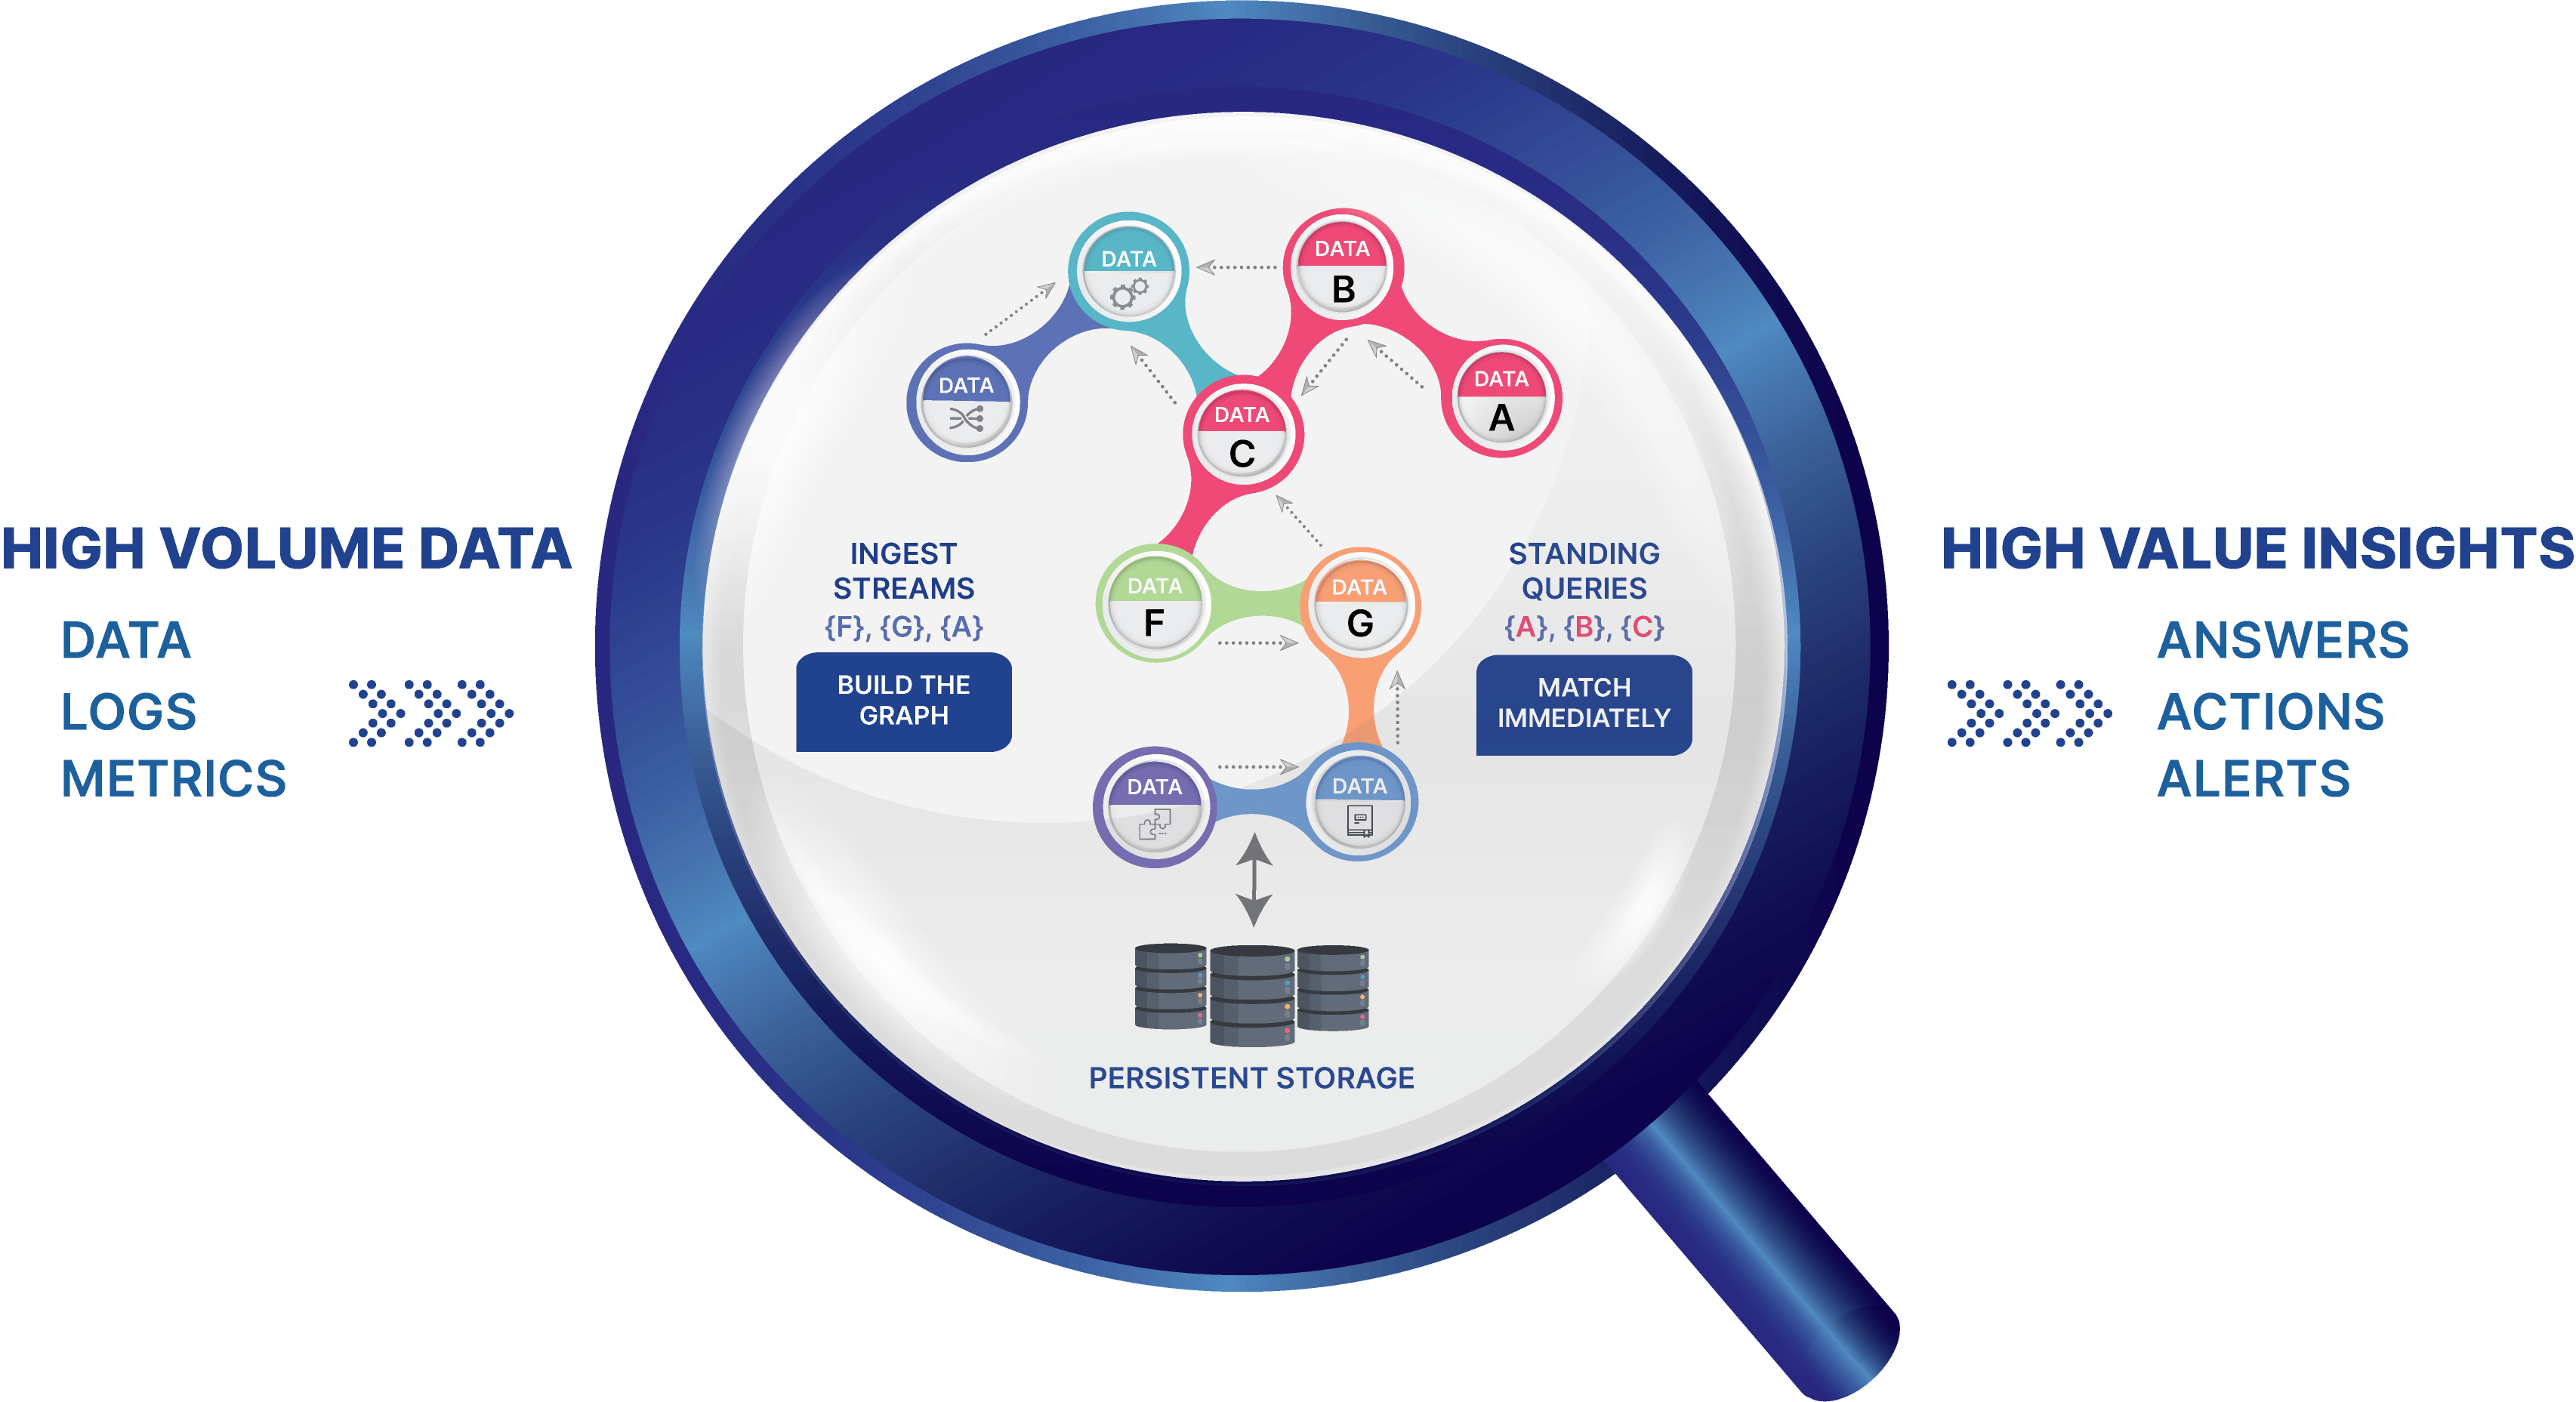
Streaming graph solves complex event processing challenges. 

Connect to your existing streaming event pipeline. 


See For Yourself 
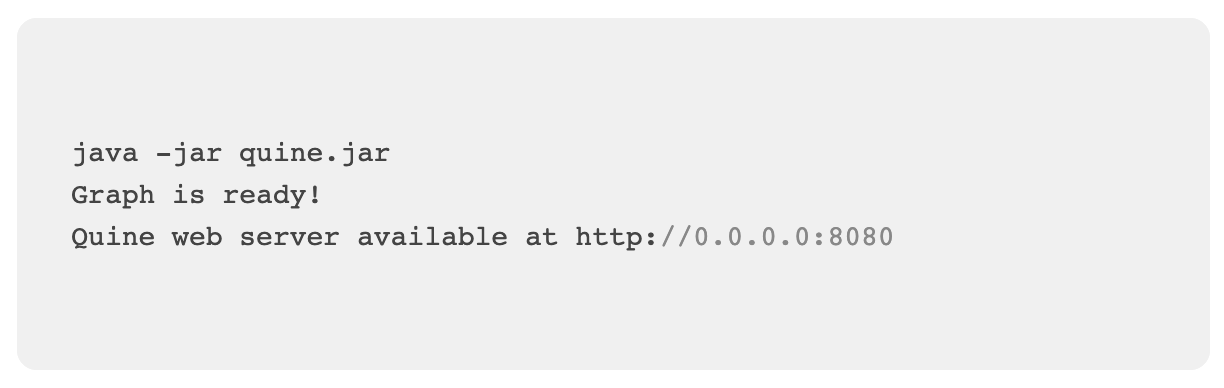
Launch the Quine app
Download the executable, build from source code on Github, or run a Quine Recipe to run a pre-configured workflow to deliver real-time answers for a specific use case.
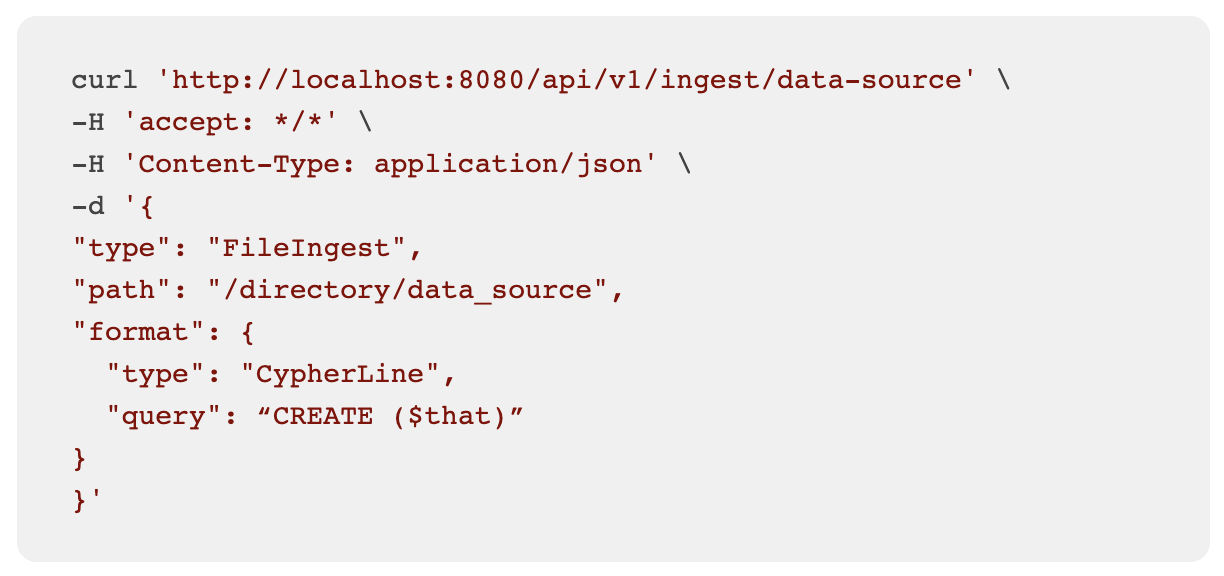
Ingest Data, Build Your Graph
An API call sets the ingest source, format, and mapping of data elements to the streaming graph. The graph data model mitigates out-of-order data delivery issues.
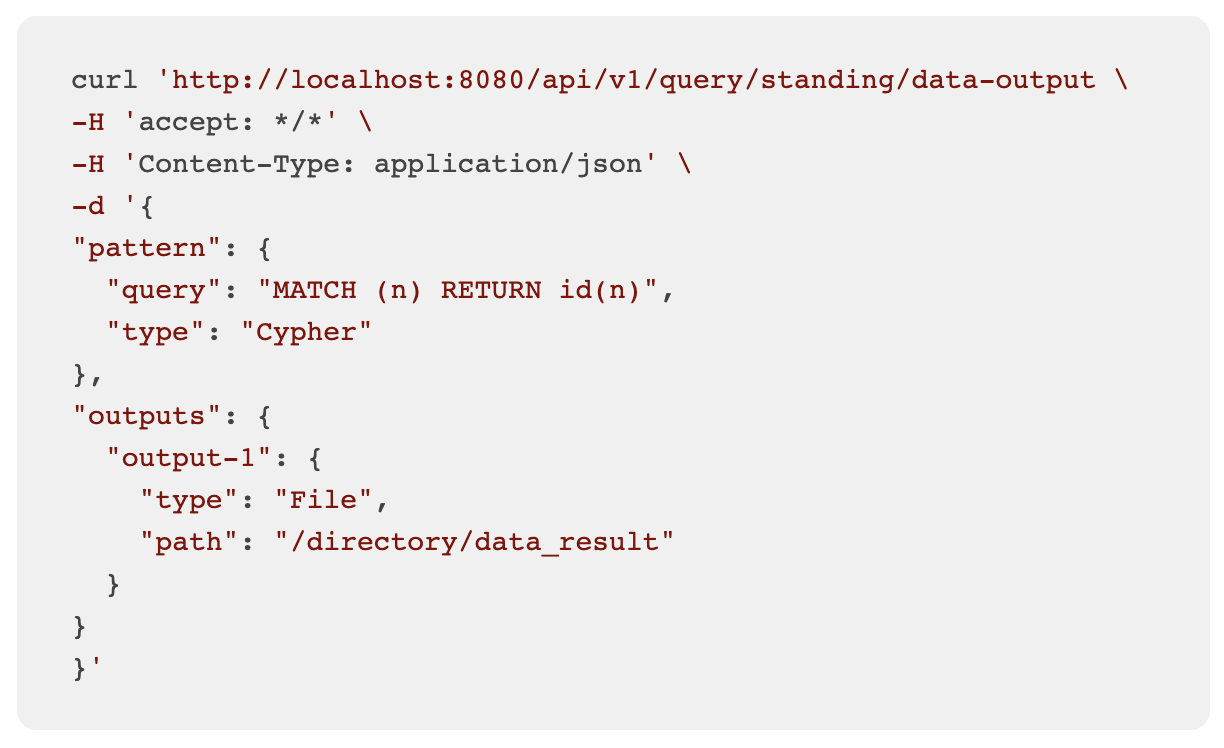
Define Standing Queries
A second API call sets the standing query to monitor for complex patterns and trigger actions for each match. Standing queries are distributed across the streaming graph and continuously propagate as new data is ingested. Partial matches are stored in the graph, enabling high-throughput and real-time results.
Learn more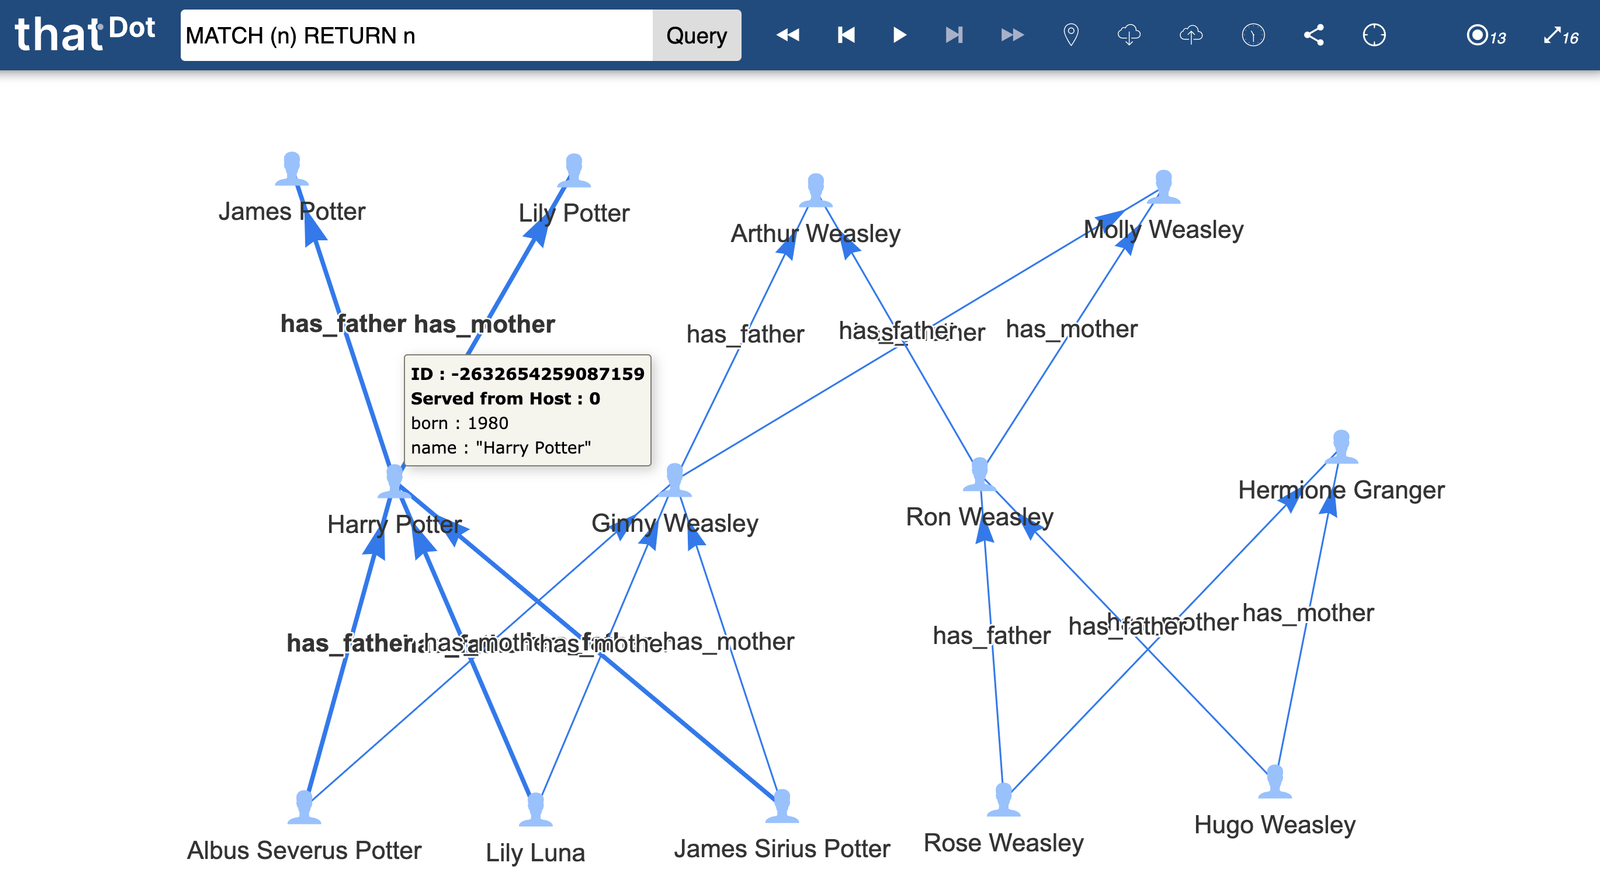
Explore Your Data
Directing a browser to localhost port 8080 brings you to the Data Exploration UI, where you can explore the graph, interact with the REST API or view operational metrics.
Learn moreWhat our users say 

Matt Splett
Principle Engineer, Tripwire
Using Quine, I replaced pages of complex custom logic and SQL queries with simple queries for the stream computed rollup value that updates at each underlying event change.

Jim Plush
Distinguished Engineer, CrowdStrike
Quine represents a paradigm shift in online graph processing capabilities. By allowing data to react to itself as well as its relationships in real time, it gives you the capability to augment your graph on the fly and free up downstream consumers to react to changes without having to keep asking the same questions. This allows building more performant services with fewer resources.

Kevin Baker
Principle Architect, Analog Devices
Being a Kubernetes architecture we needed to investigate the relationship between multiple related Kafka event streams to identify optimization of our compute nodes and Kubernetes autoscaling configuration. Unlike traditional and expensive reference lookups in relational databases, Quine enables us to correlate our graph-like streaming data in real-time. This has really reduced the overhead for querying our data to determine critical optimization opportunities for our platform.