Operational Considerations
Deploying: Basic Resource Planning
Quine is extremely flexible in its deployment model. It is robust and powerful enough to run on a server with hundreds of CPU cores and terabytes of RAM, but also small and lightweight enough to run in a container or on a Raspberry Pi. Custom deployment configurations (e.g. on-premise deployment, non-containerized deployments, alternate storage configurations, etc.) are available upon request.
Quine is a backpressured system; it will deliberately slow down when resource-constrained. This is a highly desirable quality because the only alternative is to crash the system. Making Quine run faster is essentially a matter of allocating resources to the machine/environment so that the slowest component is not a bottleneck.
CPU
As a distributed system, Quine is designed from the ground up to take advantage of multiple CPU cores. Quine will automatically configure increased parallelism where there are more CPU cores available. This configuration can be customized using the Pekko configuration settings for the default-dispatcher when starting up Quine.
High CPU Utilization
By design, we expect Quine to utilize as many resources as it is allotted. High CPU usage alone, without additional symptoms, is desirable and reflects good utilization of the system.
Low CPU Utilization
Quine is designed to use backpressure to limit incoming data from producers. If any aspect of the graph is overwhelmed (e.g. the data storage layer is slow), Quine will backpressure incoming data to ensure all work can complete. This mechanism provides data safety by not dropping incoming records, and system resilience by not sending more data than the graph can handle. To understand if the ingest is backpressuring, view the shared.valve.ingest.{ingest-name}.metric to see if the value is increasing. A higher value means more backpressure.
If the ingest stream parallelism setting is too low, the system may not take advantage of all the parallel processing it is capable of. This setting determines how many items from the ingest source will be causing their effects in parallel. Too low of a parallelism setting will cause the CPU to be underutilized.
RAM
System memory (RAM) is used by Quine primarily to keep nodes in the graph warm in the cache. When a node required for a query or operation is needed, if it is live in the cache, then calls to disk can often be entirely avoided. This significantly increases performance and throughput of the system overall. So in general, the more nodes live in the cache, the faster the system will run.
Note
Quine uses a novel caching strategy that we call "semantic caching". The net result is that there is a decreasing benefit to having additional nodes kept in memory. There is only a performance improvement if those nodes are needed.
Since Quine runs in the JVM, you can have Quine use additional system RAM in the standard Java fashion by increasing the maximum heap size with the -Xmx flag when starting the application. E.g.: java -Xmx6g -jar quine-2.1.0.jar. In order for Quine to receive a benefit from increased RAM, you will probably also need to increase the limit of nodes kept in memory per shard by changing the in-memory-soft-node-limit, and possibly the in-memory-hard-node-limit sizes. See the Configuration Reference for details. The ideal setting for these limits depends on the use case and will vary. We suggest monitoring usage with the tools described below to determine the best settings for your application. In-memory node limits can be changed dynamically from the built-in REST API with the shard-sizes endpoint.
Warning
Keep in mind that setting the maximum heap size is not the same as limiting the total memory used by the application. Some amount of additional off-heap memory will be used when the system is operating normally. Off-heap memory usage is usually trivial, but can become significant in some cases, e.g.: Lots of network traffic, or using memory mapped files. The latter case can become very significant when using the MapDB persistor, which defaults to using memory mapped files for local data storage.
Out of Memory Error
Quine can be configured to use any amount of RAM. The settings for in-memory-soft-node-limit and in-memory-hard-node-limit should be adjusted according to the workload in proportion to the amount of memory available on the system. If you encounter an Out-of-Memory error, we suggest lowering the soft limit. This setting can be adjusted while the system is running via an API call.
Storage
Quine stores data using one or more Persistor. Persistors are either local or remote. A local persistor will store data on the same machine where Quine is running, at a location in the filesystem determined by its configuration. A remote persistor will store data on a separate machine. By default, Quine will use the local RocksDB persistor.
For production deployments, we recommend using a remote persistor like Cassandra to provide data redundancy and high-availability. Additionally, old data can be expired from disk using Cassandra's time-to-live setting in order to limit the total size of data stored.
Monitoring
It is often helpful to watch an operating system to confirm it is behaving as anticipated. Quine includes multiple mechanisms for monitoring a running system.
For a set of production alert recommendations built on these metrics — what to watch and at what warning/critical levels — see Recommended Alerts.
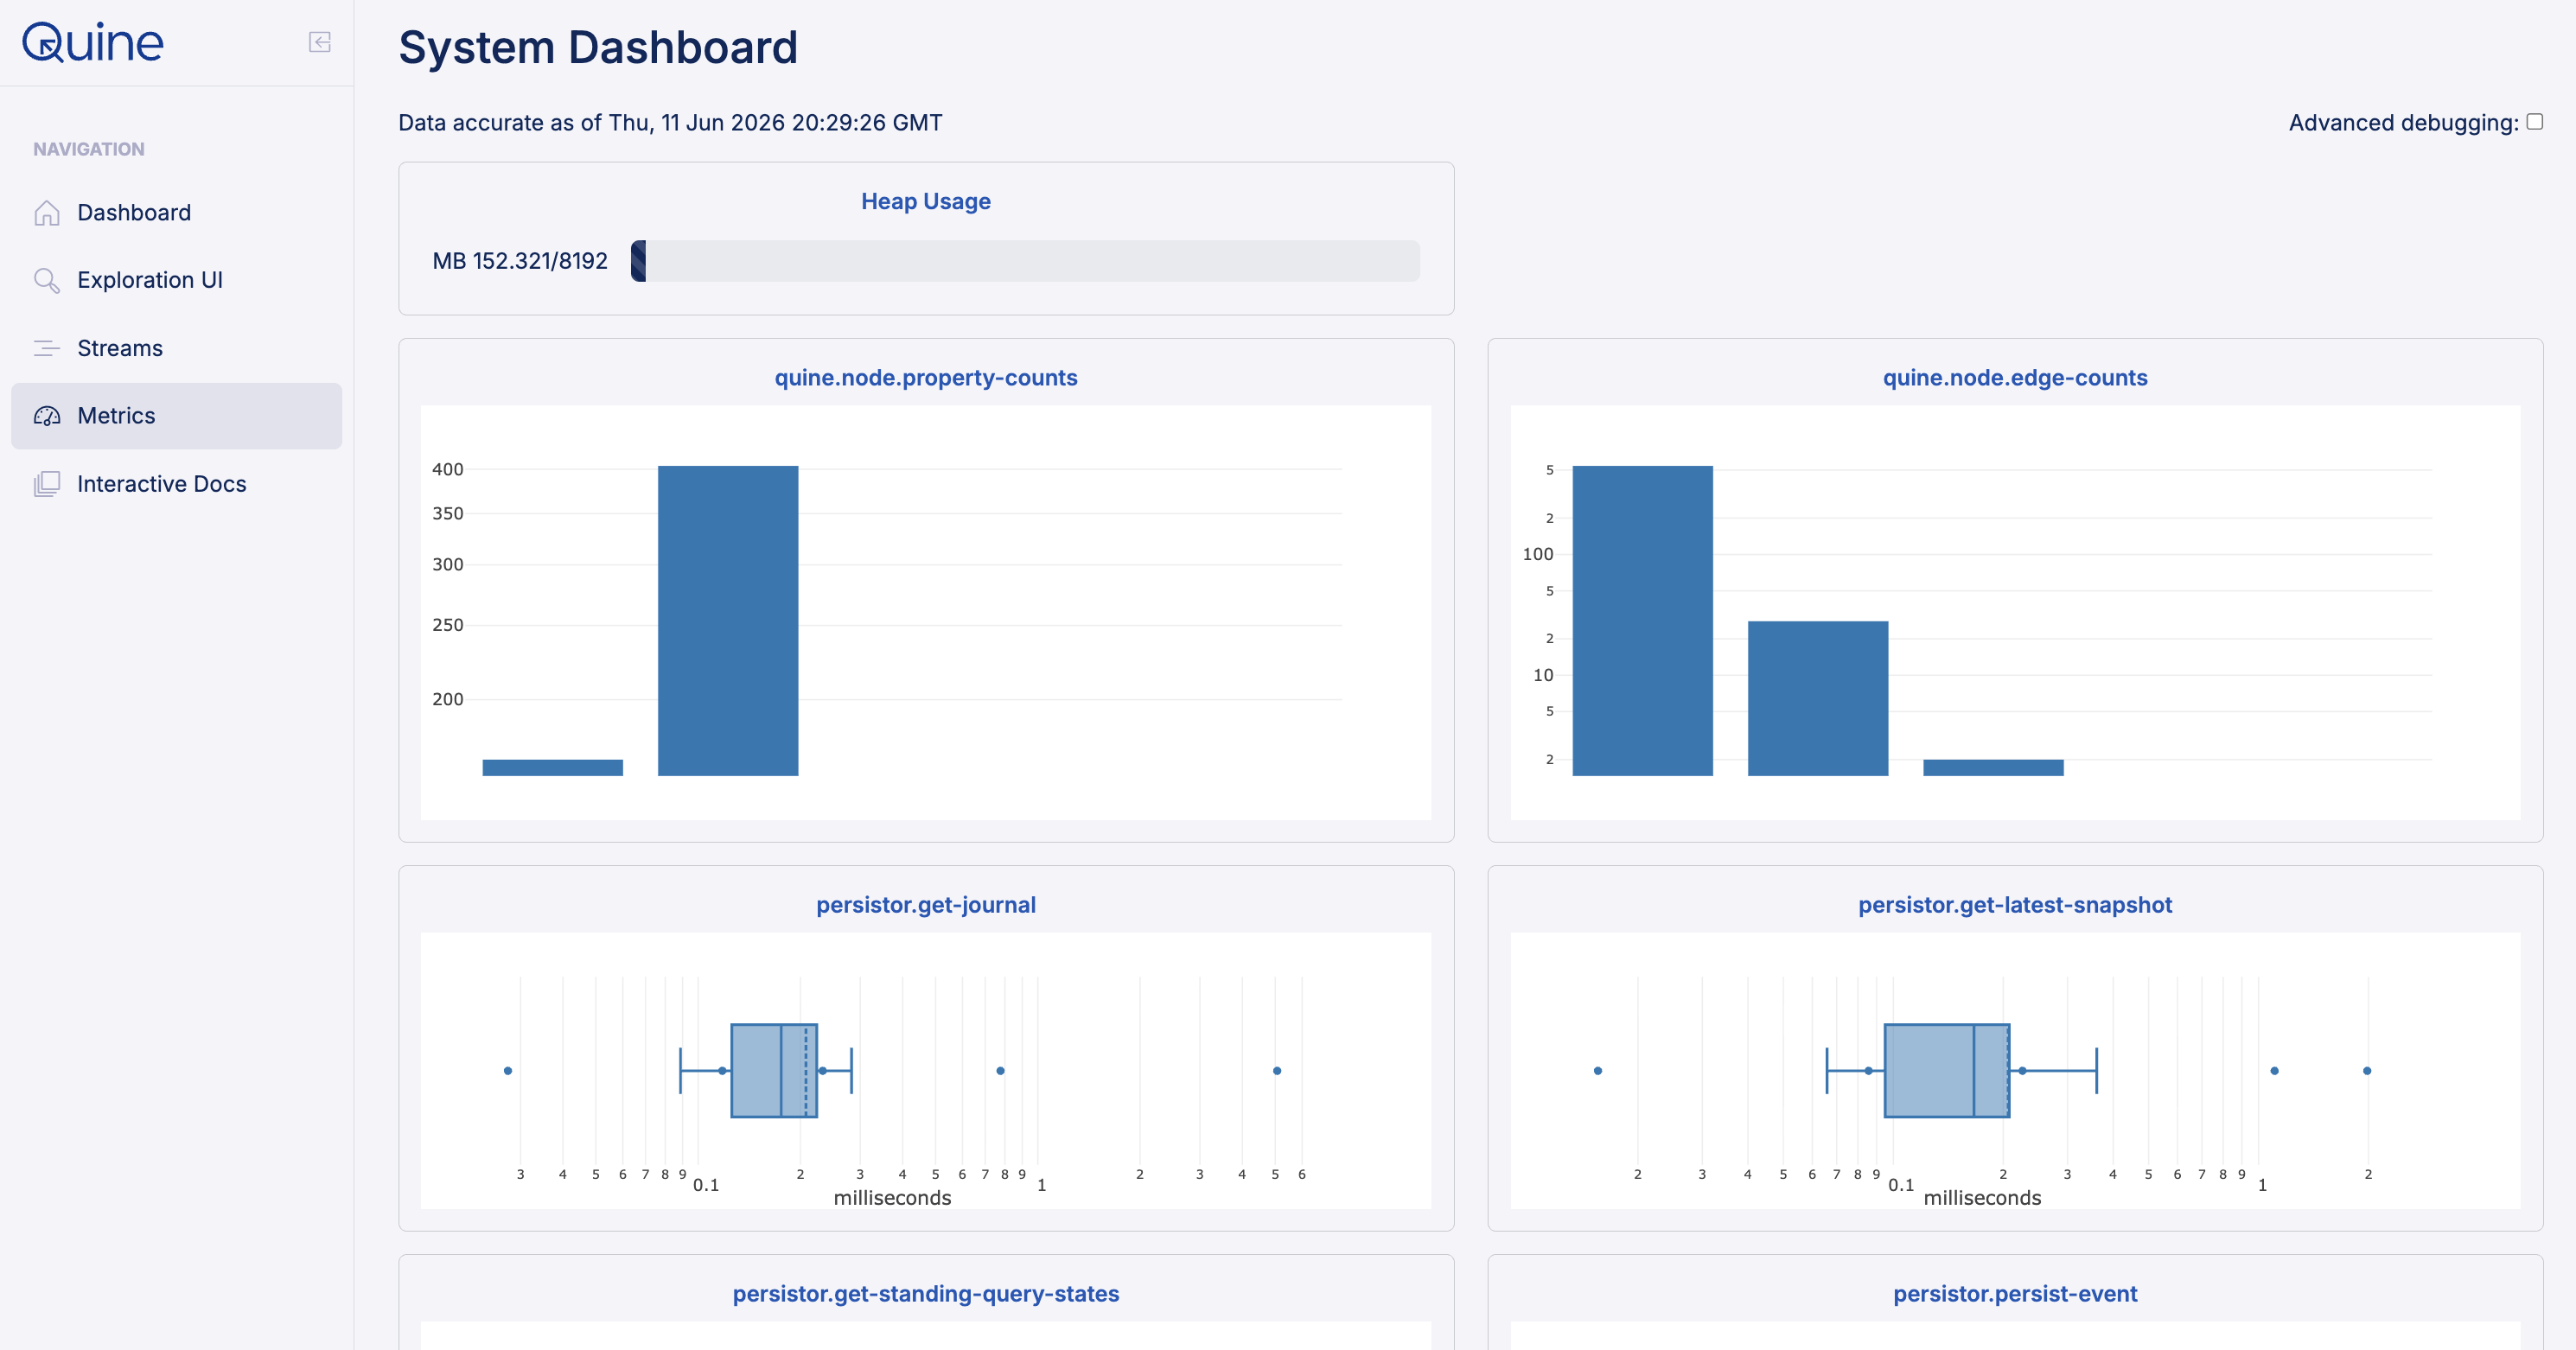
Web Browser
The Quine web UI includes a metrics page (/metrics) with live-updating reports on memory usage, nodes in the cache (per shard), basic histograms of the number of properties and edges per node, and latency measurements of various important operations.
REST API
Quine serves a REST API from its built-in web server. That web server provides separate Process Readiness: GET /api/v2/system/readiness and Process Liveness: GET /api/v2/system/liveness API endpoints for monitoring the status of the Quine system. Detailed metrics can be retrieved from the Metrics: GET /api/v2/system/metrics endpoint.
JMX
Quine can be monitored and controlled live using JMX. There is a wide array of tools available for monitoring JVM applications through JMX. If you don't already have a preference, you might start with VisualVM.
Quine Enterprise
Quine Enterprise adds clustering, failover, and Kubernetes Helm deployment. Compare editions.